A domain under investigation shows erratic resolutions, example.com hopping IPs or nameservers in logs. Is it benign scaling, or fast-flux evasion? Piecing together historical ASNs, IP sprawls, and NS changes across tools disrupts focus.
The Infrastructure Variance view delivers a unified timeline of these evolutions in Total View, with sub-tabs for ASN, IP Diversity, and Name Server Changes. It flags anomalies, such as sudden diversity spikes, by tying raw data to risk scores for rapid triage.
Infrastructure Variance draws from Silent Push’s passive DNS and infrastructure datasets, complementing PADNS for resolutions and Whois for registrant context. Total View integrates it all, enabling pivots to IOFA feeds for actor attribution.
Infrastructure shifts can signal threats, fast-flux for evasion, high-density nameservers for compromise, or ASN hops to bulletproof hosts. Manual tracking across queries can miss connections; this view consolidates both historical and real-time data to assess stability and risk.
Security teams use it to detect unusual patterns (e.g., 15 IPs in 30 days on outlier Autonomous System Numbers, or ASNs), while brand defenders map exposures. Pair with PADNS for underlying A/AAAA records, or with WHOIS for ownership changes, and explain variances. Examples include correlating an ASN switch from AS15169 to AS207713 with IOFA hits, indicating known adversary infra.
How It Works
Silent Push’s in-house aggregation engine compiles passive DNS and routing data into timelines, highlighting evolutions without third-party dependencies. Sub-tabs break it down: ASN for network providers, IP Diversity for address sprawl, Name Server Changes for DNS management.
Raw details, such as ASN takedown scores (0-100), IP counts with timestamps, and NS density, populate filterable tables. Basic Raw Data mode provides unprocessed outputs (e.g., exact IP lists) for verification. It correlates with other tabs: An NS shift here might align with PADNS anomalies, prompting Dangling DNS checks for takeovers.
Data is timestamped (e.g., change on 2025-09-01), with one-click enrichments to subnets or feeds, ensuring precise, self-sourced intel for SIEM exports or notebooks.
Generate a Set of Results
Input a domain (e.g., example.com) via the search bar to launch Total View, and switch to Infrastructure Variance.
Sub-tabs load automatically: ASN lists historical providers, IP Diversity charts address timelines, Name Server Changes logs, and DNS shifts.
Toggle Domain Wide View for subdomain inclusion and filter by date or metric.
Example
Query example.com in Infrastructure Variance: ASN sub-tab shows a hop from AS15169 (Cloudflare, takedown score 95) to AS207713 (subnet details, score 20) on 2025-09-01—flagging potential flux. IP Diversity visualizes 15 IPs over 30 days, with 10 on the new ASN (triggering an outlier alert), and timestamps are tied to PADNS A records.
Name Server Changes tracks a switch from ns1.example.com to ns2.example.com (density: 10,000 domains), dated 2025-08-31.
Enrich the ASN row for subnet pivots, or cross to WHOIS for registrant ties.
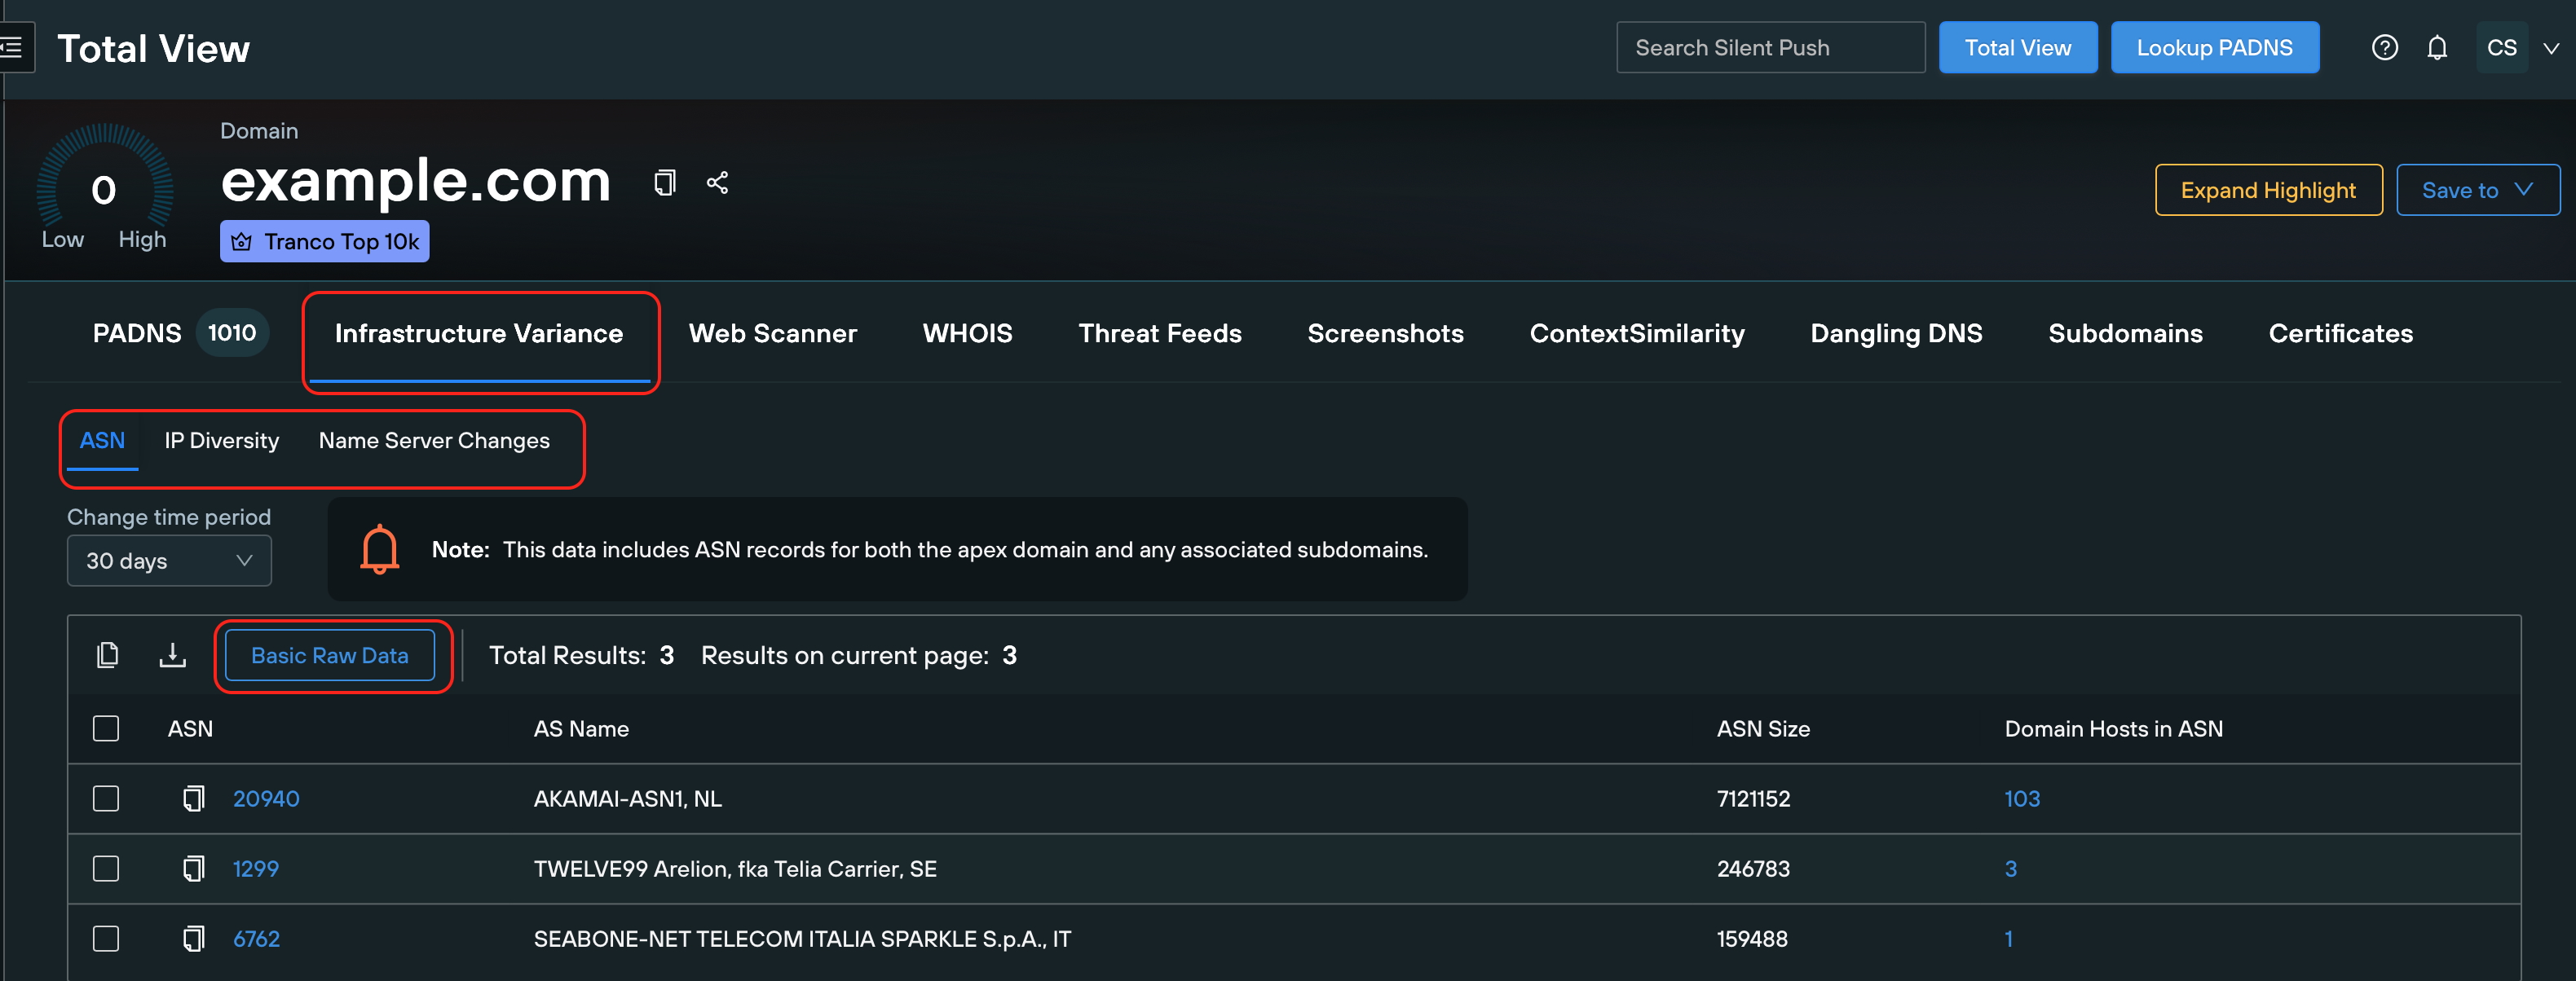
ASN Sub-tab
This tab lists historical ASNs, unique network identifiers (e.g., AS15169 for Cloudflare), that manage IP prefixes under a single routing policy.
It includes information on ASN numbers, associated subnets, and takedown reputation scores (0-100), which reflect an ISP's responsiveness to abuse.
Use Case
Detect unexpected ASNs (e.g., AS207713); investigate via WHOIS for linked domains to identify bad actors. One-click enrichment explores subnets/threat intel; pivot to PADNS for A/AAAA records tied to the ASN.
IP Diversity Sub-tab
This tab provides a visual and numerical display of IP address changes over time, including hosting ASNs. It also provides raw data on IP counts (e.g., 15 IPs in 30 days) and identifies outlier ASNs that are not typical for the domain.
Use Case
Identify sudden increases (e.g., 10 IPs on 2025-09-01, one on AS212819), suggesting manipulation. Map in Attack Surface Mapping for exposures; cross-check PADNS for first/last seen timestamps.
Name Server Changes Sub-tab
This tab tracks changes to the nameservers managing DNS records (e.g., from ns1.example.com to ns2.example.com). It provides raw data on nameserver domains, density (domains per server), and change timestamps.
Use Case
Spot switches to high-density servers (e.g., 10,000 domains), indicating shared/compromise risks. Investigate takeovers via Dangling DNS in Subdomains or Attack Surface Mapping; correlate with WHOIS for registrar history.
Work with Infrastructure Variance
The view centralizes data, complementing PADNS (for resolutions that feed variance) or Web Search (for content tied to new IP addresses). An ASN change here might match a PADNS IP anomaly, enabling holistic assessment.
Rows support pivots: Basic Raw Data yields unprocessed details (e.g., exact ASN/IP lists) for verification. Export CSVs, set watches (e.g., new hops), or chain to Dangling DNS for subdomain risks.